Showing posts with label Data. Show all posts

Monday, May 9, 2016

The broad appeal of Captain America Civil War

Could it be because the age of the actors cuts across a wide spectrum?

Actor Year Of Birth Decade of birth Age Age decade
Chris Evans 1981 80s 35 30s
Robert Downey Jr 1965 60s 51 50s
Scarlett Johansson 1984 80s 32 30s
Sebastian Stan 1982 80s 34 30s
Anthony Mackie 1978 70s 38 30s
Don Cheadle 1964 60s 52 50s
Jeremy Renner 1971 70s 45 40s
Chadwick Boseman  1976 70s 40 40s
Paul Bettany 1971 70s 45 40s
Elizabeth Olsen 1989 80s 27 20s
Paul Rudd 1969 60s 47 40s
Emily VanCamp 1986 80s 30 30s
Tom Holland 1996 90s 20 20s


Nah, it's probably just because it's a good story. (Not great - but better than Age of Ultron).

Tuesday, December 4, 2012

Venetian curiousity

This picture of flooding in Venice last month reminded me about a previous story about how the population of Venice was falling because of constant flooding. If I Google “Venice population” I find this news story from 2009 in the Telegraph:

Official census figures show the city's permanent population was 59,984 as of last week.
The population has been sliding for years, from 174,000 in 1951 to 70,000 in 1996, prompting fears that the city's days as a sustainable community are numbered.

But many locals say that with the city besieged by an average of 55,000 tourists a day, residents are almost outnumbered by the day-tripping hordes.

One group of Venetians is to hold a "funeral" for the city once known as the Queen of the Adriatic.

A coffin symbolising the death of the city will be borne down the Grand Canal in a procession of three boats during a ceremony to be held on Nov 14.

It will be carried ashore and deposited outside the town hall, close to the famous Rialto Bridge.
Many Venetians are concerned that high property prices and rental costs are forcing ordinary people out of the city and draining it of normal life.

But the same search terms also return data from Google’s Public Data which shows the population of Venice has been rising. Since this data is in millions, I assume that the geographic area covered is larger than the city proper. A smaller geographic area is documented by Wikipedia which puts the population at 270,000 in 2009. (It also cites the 60,000 number in Venice as I think of it but it cites a news article rather than a statistical agency. A more recent NPR story is here (circa 2012) where the 60,000 number is also repeated.)

There is also a nice graphic here which sort of put my curiosity to rest although it lacks documentation on sources except for citing the city council of Venice. I find it a little perplexing that the raw data is so hard to come by not only because this is the age of the Internet but because Italy is supposedly an advanced economy.


Finding the population of Venice, Florida, however, was not as difficult.

Wednesday, October 17, 2012

Data scientist(?)

One of the apparently ‘hot’ jobs these days is the data scientist. So hot in fact that the Harvard Business Review has named it the sexiest job of the 21st century. I came across Rachel Schutt’s Data Science class at Columbia (HT: Andrew Gelman) and she has a description of what a data scientists does (or should do):

What is a Data Scientist?
Let me start with academia because that’s quicker. Then industry.
In Academia: No one calls themselves a Data Scientist yet in universities. There are 60 students in my class from across disciplines. I thought when I proposed the course it would be statisticians, applied mathematicians and computer scientists who showed up. Actually it’s them plus sociologists, journalists, political scientists, biomedical informatics students, students from NYC government agencies and non-profits related to social welfare, someone from the architecture school, environmental engineering, pure mathematicians, business marketing students, and students who already work as data scientists. Am I missing someone? They’re all interested in figuring out ways to solve important problems, often of social value, with data.

For the term Data Science to catch on in academia at the level of the faculty, the research area needs to be more formally defined. I see a rich set of problems that could be many PhD theses. My current working definition is a Data Scientist in this setting is a Scientist (from social scientists to biologists) who work with large amounts of data, and must grapple with computational problems posed by the structure, size, messiness and nature of the data, while simultaneously solving a real world problem. Across academic disciplines, the computational and deep data problems are the same. So if researchers across departments join forces, they can solve multiple real-world problems from different domains.

In Industry:
It depends on the level of seniority and whether you’re talking about the internet industry in particular. The role of data scientist need not be exclusive to the tech world, but that’s where the term originated so for the purposes of the conversation, let me say what it means there:

A Chief Data Scientist should be setting the data strategy of the company which involves a variety of things: setting everything up from the engineering and infrastructure for collecting data and logging, to privacy concerns; deciding what data will be user-facing, how data is going to be used to make decisions, and how it’s going to be built back into the product. She should manage a team of engineers, scientists and analysts and she should communicate with leadership across the company including the CEO, CTO and product leadership. She’ll also be concerned with patenting innovative solutions, and setting research goals.

More generally, a data scientist is someone who knows how to extract meaning from and interpret data, which requires both tools and methods from statistics and machine learning, as well as being human. She spends a lot of time in the process of collecting, cleaning and munging data, because data is never clean. This process requires persistence, statistics and software engineering skills– skills that are also  necessary for understanding biases in the data, and for debugging logging. Once she gets the data into shape, a crucial part is exploratory data analysis which combines visualization and data sense. She’ll find patterns, build models and algorithms, some with the intention of understanding product usage and the overall health of the product, and others serve as prototypes that ultimately get baked back into the product. She may design experiments, and is a critical part of data-driven decision making. She’ll communicate with team members, engineers, and leadership in clear language and using data visualizations so that even if her colleagues are not immersed in the data themselves, they will understand the implications.

Looking at the syllabus it sure sounds a lot like data mining. I guess being a scientist beats being a miner.

Sunday, July 15, 2012

Reliability of electricity

Last week we were out in Edinburg/Woodstock area near the Shenandoah Mountains. As is sometimes the case, we came across a bulletin board outside a realtor’s office and looked at what was available for sale in the area.

I was a little surprised to see a home for sale with a whole house generator. These have become quite popular in recent years with an increasingly (and seemingly) unreliable power grid. I was surprised for several reasons:

  1. I expected more homes in rural areas to be more off the grid than most, i.e. propane for heating and perhaps for running electricity, septic tank, well water, etc.
  2. I expected people from rural Virginia to be hardier than Washingtonians (then again, perhaps the seller was a Washington transplant - or perhaps I have a misplaced bias)
  3. I expected that dense cities were more vulnerable in terms of length of outage and people affected than rural Virginia. The flip side is that the more rural you are the less likely that restoration will be quicker since utilities tend to emphasize fixes that put the most people back online as soon as possible.

Most disturbing was the sense that perhaps electricity has become much more unreliable in recent years. Unfortunately, there appears to be no good data on the reliability of the electric grid. Scientific American reports based on an MIT report:

“Data on outages are neither comprehensive nor consistent, however. Most outages occur within distribution systems, but only 35 U.S. States require utilities to report data on [distribution outages]… it is accordingly impossible to make comprehensive comparisons across space or over time.”

The World Bank carries out surveys of electricity outages and its effects on manufacturing industries but the US is a non-respondent. A backup power supplier, Eaton has a report of blackouts in the United States (register for download) but only has data for 3 years which makes it hard to detect a trend.

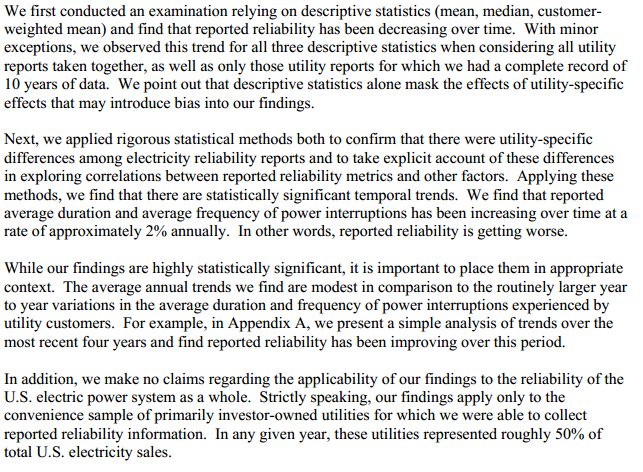
More promising are reports from LBL, in particular this and this. From the latter, is the conclusion of a study in January 2012:


In other words, we still don’t know what we don’t know.

Monday, April 9, 2012

What causes the unemployment rate to fall

In a previous post, I wondered whether the unemployment rate falls more because of people leaving the labor force or because of job creation. WaPo comes down on the former at least as far as the latest job numbers are concerned:

In March, the unemployment rate dropped from 8.3 percent from 8.2 percent. But that wasn’t because the economy added an enormous number of jobs.

Rather, as Sarah Kliff pointed out, it was largely due to the fact that 164,000 fewer people were actively looking for work — and they don’t count in the unemployment tallies.

Wednesday, January 11, 2012

How much stuff do we have


In a previous post on the stagnation of median incomes I had suggested that another alternative measure would be “how much more stuff” the median household or median person have had over time. The data source that might contain this data is the Consumer Expenditure Survey. Unfortunately, this data is not publicly available for free download but is available for sale. My knee jerk reaction is: Isn’t there something wrong about selling data that has been collected using public funds? The only other data is from the NBER but this only goes up to 2003.

Assuming we had the data, the measure might be whether the proportion of after tax income that is spent on food, housing, expenditure and health has decreased over time by the median person or household.

Friday, November 4, 2011

Counting people


We’re trying to count people but we’re not coming up with numbers that make much sense - or differences that are troubling. Let’s back up. We’re trying to count people by educational attainment. The following is for those 25 years and over:

Based on the 2010  American Community Survey:
Estimate Margin of Error
Some college, less than 1 year12,846,799+/-80,342
Some college, 1 or more years, no degree30,622,369+/-89,558
Associate's degree15,553,106+/-65,380
Bachelor's degree 36,244,474+/-119,630


From the 2010 Digest of Education Statistics (based on the Current Population Survey):
Estimate Margin of Error
Some college33,662,000+/-186,900
Associate's degree18,259,000+/-142,700
Bachelor's degree 38,784,000+/-198,100

These differences cannot be accounted for by sampling error - the margin of error is smaller than the differences between the two surveys in most cases. 

Presumably, the larger margin of error in the CPS March supplement data is due to its smaller sample size. Also the March Supplement is a monthly sample (actually collected over 3 months) versus the ACS which is collected over the course of the year. The ACS website states:

The strength of the ACS is in estimating characteristic distributions. We recommend users compare derived measures such as percents, means, medians, and rates rather than estimates of population totals.

The ACS seems to be a more complete sample in terms of its coverage (both in geography and time frame) yet defers to the CPS when totals are being reported (based on above statement). Moreover, the CPS continues to be the official source for poverty estimates. A guidance and fact sheet are available as well as some differences between CPS and ACS.

As far as I can tell Census has not made any attempt to reconcile the differences and I don’t really know if they can. I would assume the ACS numbers to be superior in terms of educational attainment and anywhere where I would think of numbers on an annualized basis. The deference to the CPS in terms of poverty seems from the outside to be a bureaucratic wrangle between two divisions and/or a desire to preserve continuity in time series.

Wednesday, October 26, 2011

Median incomes revisited


In a previous post, I was not able to find any evidence that median incomes had stagnated since 1973. Courtesy of the Atlantic, the graphic indicates that median earnings for men have indeed stagnated since the early 70s.

Tuesday, August 30, 2011

BLS research on worker flows using CPS

I was pointed to the following research from the BLS on measuring worker flows using the monthly CPS. Researchers have been doing this for a while now, with the main focus on the outgoing rotation groups. The matching process is not perfect but I have to believe that the folks at BLS have access to better matching keys than outside researchers.

It bothers me that this was kind of buried in the BLS website and that the matched micro data is not available for download. What if I were interested in transition rates by race, educational attainment, and age groups? Or geographic region?

Tuesday, May 31, 2011

How occupations change

In the 1970 Census Occupational Codes:

Code #264: Hucksters and Peddlers

Saturday, April 16, 2011

The Statistical Abstract of the United States

May it RIP. In a previous post I linked to the 2011 edition of the Statistical Abstract of the United States. I was at a Census conference last month where it was announced that Census will no longer be publishing this series. This was one item that did not survive the budget cuts.

This used to be the go-to source for statistics before the days of Google. While I'm sad to see it go, in the current age, the Abstract while useful for pointing to the data source of the table is a product of the pre-Internet era. We use to put together time series by hand from various editions of the Abstract and today this is no longer necessary. Nor is it necessary to publish this as a hardbound book. I'd like to Census use this opportunity to re-launch the information on the Internet in a more interactive form.

The strength of the Abstract was in its summarized form e.g. by state and a snap-shot for various years. While it would be infeasible to pull all the information together from scratch, it would be great to at least link all the tables to the main data sources and if possible for the user to generate additional time points that are not shown or to re-summarize the data at a different level.

If DC were a state Part II

In a previous post, if DC were a state, it would rank as having the highest per capita income. What about if it were ranked on median income. The data for 2010 is not available, nor is the data available for personal income. The following for 2008 is for personal per capita income and median household income, courtesy of the 2011 Statistical Abstract.

11 states are ranked higher than DC in household median income, but DC is still highest in terms of per capita income.

StatePersonal Per capita incomePersonal Per capita income rankMedian household incomeMedian Household Income rank

United States40208(X)52029(X)

Alabama33768424266646

Alaska440398684604

Arizona34335415095822

Arkansas32397463881548

California436419610219

Colorado42985125699313

Connecticut562721685953

Delaware40519185798911

District of Columbia66119(X)57936(X)

Florida39267214777833

Georgia34893385086123

Hawaii4205515672145

Idaho33074444757634

Illinois42347145623516

Indiana34605404796632

Iowa37402284898029

Kansas38820235017725

Kentucky32076474153847

Louisiana36424314373341

Maine36457304658136

Maryland483786705451

Massachusetts512543654016

Michigan34949374859130

Minnesota43037115728812

Mississippi30399503779050

Missouri36631294686735

Montana34644394365442

Nebraska39150224969328

Nevada41182175636115

New Hampshire4362310637317

New Jersey513582703782

New Mexico33430434350844

New York4875345603317

North Carolina35344354654937

North Dakota39870204568539

Ohio36021334798831

Oklahoma35985344282245

Oregon36297325016926

Pennsylvania40140195071324

Rhode Island41368165570118

South Carolina32666454462540

South Dakota38661254603238

Tennessee34976364361443

Texas37774265004327

Utah31944485663314

Vermont38686245210420

Virginia442247612338

Washington42857135807810

West Virginia31641493798949

Wisconsin37767275209421

Wyoming4860855320719