Some thoughts about the Oregon Health Study - which is being dissed by MR here and here.
First off the comparison of this study to Reinhart and Rogoff is way off base. Reinhart and Rogoff were recalcitrant in sharing their data. Had they been more forthcoming in the first place it is possible that someone would have pointed out the Excel error much earlier. Instead they left all the researchers puzzled over their attempts to replicate their findings. This is NOTHING like Reinhart Rogoff.
What if they had found positive effects? Then I think the debate would have shifted to size effects and whether the results were meaningful in any sense. The critics are leaping to the "no result" finding as a way to justify their opposition. They would probably have leaped to a positive result by pointing out the lack of meaningful results regardless.
RCTs are pretty useless in this debate. Think of their outcomes - blood pressure, hypertension and cholesterol levels. How can having insurance by itself promote better outcomes? To actually change these outcomes, insurance holders have to actually change their behavior. There is a lot of behavioral economics evidence out there to argue against anyone actually doing anything about this regardless of health insurance status.
This is an example of RCTs taking away the analysts' ability to think straight. Retrospection would have predicted the null effect. The low income population makes them even more constrained in their ability to affect lifestyle changes that would positively affected the outcome measures. I have some doubt as to whether even a high income population would have been able to affect the lifestyle changes necessary to have a detectable effect.
This is an example of RCT measuring the wrong outcome. We only measure what we can see or even worse - what is easiest to measure. By some kind of fluke these are the outcomes that are hardest to change. I have to change my diet, my exercise regimen, my sleep habits, and so forth. If this is hard for a middle class person how much harder would it be for a low income group?
Effects of the recession on health? Is it possible that the stress of the recession and the job market is driving the results in both treatment and control?
This randomized study should have been titled something like "How much do people take their doctors' advice in changing their lifestyles? An analysis of low income population using Medicaid lotteries" or something similar. Would the findings have made any headlines then?
Alternatively, if the study participants were given medications to treat their hypertension, cholesterol, etc. then the study would have been about the efficacy of drugs on the low income population. Or perhaps prescription drug compliance among the low income population.
The comeback "You still buy health insurance don't you?" is a reasonable response contrary to what Tyler Cowen thinks. And this returns to the possibility that the benefits of ACA and expansion of Medicaid was oversold. Why do we buy health insurance - surely not to become healthier. We buy insurance to preserve the status quo, i.e. I don't want my health to get worse and if it gets worse then at least I can do something about it. I have health insurance and I can go to the doctor. And when we think about health we generally don't think in terms of cholesterol or blood pressure. We think of actual illnesses, pain, discomfort, etc. and again evidence from behavioral economics may be useful here.
What is going here I think is that possibly and perhaps in fact, very likely that supporters of ACA felt they had to justify the expansion of Medicaid by some evidence based reason and like their opponents who will grab at anything they can to fight against it they fell onto the belief that health insurance improves overall health - not specific illnesses, but overall health because it was easier to measure in an RCT.
Instead of making arguments for ACA on grounds of equity and perhaps even a right to adequate care and a right not to impose the costs of emergency room visits on others, etc. they have backed themselves into a corner with this null finding.
Showing posts with label Statistics. Show all posts
Showing posts with label Statistics. Show all posts
Monday, May 6, 2013

Wednesday, October 17, 2012
Data scientist(?)
One of the apparently ‘hot’ jobs these days is the data scientist. So hot in fact that the Harvard Business Review has named it the sexiest job of the 21st century. I came across Rachel Schutt’s Data Science class at Columbia (HT: Andrew Gelman) and she has a description of what a data scientists does (or should do):
Looking at the syllabus it sure sounds a lot like data mining. I guess being a scientist beats being a miner.
What is a Data Scientist?
Let me start with academia because that’s quicker. Then industry.
In Academia: No one calls themselves a Data Scientist yet in universities. There are 60 students in my class from across disciplines. I thought when I proposed the course it would be statisticians, applied mathematicians and computer scientists who showed up. Actually it’s them plus sociologists, journalists, political scientists, biomedical informatics students, students from NYC government agencies and non-profits related to social welfare, someone from the architecture school, environmental engineering, pure mathematicians, business marketing students, and students who already work as data scientists. Am I missing someone? They’re all interested in figuring out ways to solve important problems, often of social value, with data.
For the term Data Science to catch on in academia at the level of the faculty, the research area needs to be more formally defined. I see a rich set of problems that could be many PhD theses. My current working definition is a Data Scientist in this setting is a Scientist (from social scientists to biologists) who work with large amounts of data, and must grapple with computational problems posed by the structure, size, messiness and nature of the data, while simultaneously solving a real world problem. Across academic disciplines, the computational and deep data problems are the same. So if researchers across departments join forces, they can solve multiple real-world problems from different domains.
In Industry:
It depends on the level of seniority and whether you’re talking about the internet industry in particular. The role of data scientist need not be exclusive to the tech world, but that’s where the term originated so for the purposes of the conversation, let me say what it means there:
A Chief Data Scientist should be setting the data strategy of the company which involves a variety of things: setting everything up from the engineering and infrastructure for collecting data and logging, to privacy concerns; deciding what data will be user-facing, how data is going to be used to make decisions, and how it’s going to be built back into the product. She should manage a team of engineers, scientists and analysts and she should communicate with leadership across the company including the CEO, CTO and product leadership. She’ll also be concerned with patenting innovative solutions, and setting research goals.
More generally, a data scientist is someone who knows how to extract meaning from and interpret data, which requires both tools and methods from statistics and machine learning, as well as being human. She spends a lot of time in the process of collecting, cleaning and munging data, because data is never clean. This process requires persistence, statistics and software engineering skills– skills that are also necessary for understanding biases in the data, and for debugging logging. Once she gets the data into shape, a crucial part is exploratory data analysis which combines visualization and data sense. She’ll find patterns, build models and algorithms, some with the intention of understanding product usage and the overall health of the product, and others serve as prototypes that ultimately get baked back into the product. She may design experiments, and is a critical part of data-driven decision making. She’ll communicate with team members, engineers, and leadership in clear language and using data visualizations so that even if her colleagues are not immersed in the data themselves, they will understand the implications.
Looking at the syllabus it sure sounds a lot like data mining. I guess being a scientist beats being a miner.
Wednesday, September 26, 2012
Unconditional vs conditional probability in burglaries
One of the things we do when we go out of town for an extended period of time is to double lock all our doors, etc. Usually if we’re out for the day - to work, for instance - we don’t bother doing this. Is this irrational?
Yes: If the probability of being burgled is an iid process.
But should I be thinking conditional probability? If the probability of being burgled depends on whether the burglar thinks the house is empty then perhaps this is rational behavior, since the probability that the house is empty is larger when we're away?
Yes: If the probability of being burgled is an iid process.
But should I be thinking conditional probability? If the probability of being burgled depends on whether the burglar thinks the house is empty then perhaps this is rational behavior, since the probability that the house is empty is larger when we're away?
Saturday, September 1, 2012
Skeptical of skeptical environmentalist and the improving state of the world
I decided to make a go these two books: The Skeptical Environmentalist by Bjorn Lomborg and the Improving State of the World by Indur Goklany.
My skepticism lies not so much with their presentation nor the statistics. My skepticism is whether I should be skeptical about all the optimism. Lomborg attacks Lester Brown of the Worldwatch Institute and specifically about how data is presented in its annual State of the World reports. Lomborg claims that the reports presents statistics in a biased manner since it does not take the ‘long view’ into account.
I am sympathetic to this point of view - we can say that things have gotten worse by picking two points in time that make our case for us - the peak and the trough and then hide everything that has gone on in between. Alternatively we can pick some other two points in time that supports the view we are trying to make. Some comments on the web have pointed out that is possible to claim that the earth has simultaneously warmed and cooled by picking out any two points between 2000 and 2010.
I think that both books misses the larger point. (Goklany’s is a more interesting book but pretty much has the same thrust as Lomborg.) The point is not to thump our chests about how great things have been since neanderthal man walked the earth - but how much the recent past says about the future. To paraphrase someone it’s not how much better off you were than your forefathers but how much better off you were four years ago and how much better off you will be four years from now.
So all the points that are made in the books about the warming climate and pollution etc misses the larger view by appealing to the long run view. In the long run we’ll all be dead, the sun is going to go nova and we’ll be swallowed up by a black hole. I don’t care about the long run. I caer about what’s going to happen 5 or 10 years from now.
P.S. I thought the Goklany book was interesting in that it attempted to calculate I = PAT. None of the calculations were very convincing but I thought it was a valiant attempt. It also had a fairly balanced (I thought) coverage of GM crops, although this is because I’m already biased toward GM.
Update (9/4/2012):
Here are some headlines that essentially ask the relevant question - what does the recent past say about the forseeable future:
My skepticism lies not so much with their presentation nor the statistics. My skepticism is whether I should be skeptical about all the optimism. Lomborg attacks Lester Brown of the Worldwatch Institute and specifically about how data is presented in its annual State of the World reports. Lomborg claims that the reports presents statistics in a biased manner since it does not take the ‘long view’ into account.
I am sympathetic to this point of view - we can say that things have gotten worse by picking two points in time that make our case for us - the peak and the trough and then hide everything that has gone on in between. Alternatively we can pick some other two points in time that supports the view we are trying to make. Some comments on the web have pointed out that is possible to claim that the earth has simultaneously warmed and cooled by picking out any two points between 2000 and 2010.
I think that both books misses the larger point. (Goklany’s is a more interesting book but pretty much has the same thrust as Lomborg.) The point is not to thump our chests about how great things have been since neanderthal man walked the earth - but how much the recent past says about the future. To paraphrase someone it’s not how much better off you were than your forefathers but how much better off you were four years ago and how much better off you will be four years from now.
So all the points that are made in the books about the warming climate and pollution etc misses the larger view by appealing to the long run view. In the long run we’ll all be dead, the sun is going to go nova and we’ll be swallowed up by a black hole. I don’t care about the long run. I caer about what’s going to happen 5 or 10 years from now.
P.S. I thought the Goklany book was interesting in that it attempted to calculate I = PAT. None of the calculations were very convincing but I thought it was a valiant attempt. It also had a fairly balanced (I thought) coverage of GM crops, although this is because I’m already biased toward GM.
Update (9/4/2012):
Here are some headlines that essentially ask the relevant question - what does the recent past say about the forseeable future:
- Summer’s record heat, drought point to longer-term climate issues
- Wonkbook: Climate change may be to blame for extreme weather events now
- Hansen, et.al.'s Perception of climate change study. Also covered in the Economist and Think Progress.
- Cover story of September's National Geographic Magazine.
Friday, April 13, 2012
Why we look for a single cause
In a previous post, I whined about the state of econometrics, particularly the obsession with instrumental variables and single factor causes. The obvious question is why does this state of affairs persist?
"I only wish we had a single agent causing all the declines," Pettis says. "That would make our work much easier."
This is from National Geographic on colony collapse disorder.
When CCD first hit, many people, from agronomists to the public, assumed that our slathering of chemicals on agricultural fields was to blame. Indeed, says Jeff Pettis of the USDA Bee Research Laboratory, "we do find more disease in bees that have been exposed to pesticides, even at low levels." But CCD likely involves multiple stressors. Poor nutrition and chemical exposure, for instance, might pummel a bee's immunities before a virus finishes the insect off.
It's hard to tease apart factors and outcomes, Pettis says. New studies reveal that fungicides—not previously thought toxic to bees—can interfere with microbes that break down pollen in the insects' guts, affecting nutrient absorption and thus long-term health and longevity. Some findings pointed to viral and fungal pathogens working together.
"I only wish we had a single agent causing all the declines," Pettis says. "That would make our work much easier."
This is from National Geographic on colony collapse disorder.
When CCD first hit, many people, from agronomists to the public, assumed that our slathering of chemicals on agricultural fields was to blame. Indeed, says Jeff Pettis of the USDA Bee Research Laboratory, "we do find more disease in bees that have been exposed to pesticides, even at low levels." But CCD likely involves multiple stressors. Poor nutrition and chemical exposure, for instance, might pummel a bee's immunities before a virus finishes the insect off.
It's hard to tease apart factors and outcomes, Pettis says. New studies reveal that fungicides—not previously thought toxic to bees—can interfere with microbes that break down pollen in the insects' guts, affecting nutrient absorption and thus long-term health and longevity. Some findings pointed to viral and fungal pathogens working together.
Saturday, March 31, 2012
Econometric Warriors of Truth
One of the most interesting aspects of Jared Diamond’s work is the fact that there has been no attempt at finding THE truth to THE question of economic growth or collapse. He freely admits that he will not do that and points to multiple sources of causality.
It is unclear to me why economists and econometricians persist on attempting to find THE ultimate cause of some question such as financial crises. Part of the reason they have embraced randomized trials is because they divine that they can finally grasp the answer in their hands instead of exploring the deeper questions of multiple causes or intermediate outcomes that may affect the final outcome of interest.
What is even more surprising from my naive point of view is that while they have become obsessed with exogeneity and strength of their instruments they have moved away from goodness of fit statistics and analysis of variance. What does an econometric model really say when an instrument is strongly exogenous with a large t-statistic but the fit of the model is low? Even more so, what if the variance explained by the instrument is even lower? And to sound even more radical, I am surprised that few have adopted MIMIC models. Is this perhaps because (gasp) it smacks too much of structural equations without microfoundations?
In their pursuit for their idealized version of truth, economists and econometricians have perhaps more than ever acquired an extreme form of tunnel vision are unable to see the forest for the trees.
It is unclear to me why economists and econometricians persist on attempting to find THE ultimate cause of some question such as financial crises. Part of the reason they have embraced randomized trials is because they divine that they can finally grasp the answer in their hands instead of exploring the deeper questions of multiple causes or intermediate outcomes that may affect the final outcome of interest.
What is even more surprising from my naive point of view is that while they have become obsessed with exogeneity and strength of their instruments they have moved away from goodness of fit statistics and analysis of variance. What does an econometric model really say when an instrument is strongly exogenous with a large t-statistic but the fit of the model is low? Even more so, what if the variance explained by the instrument is even lower? And to sound even more radical, I am surprised that few have adopted MIMIC models. Is this perhaps because (gasp) it smacks too much of structural equations without microfoundations?
In their pursuit for their idealized version of truth, economists and econometricians have perhaps more than ever acquired an extreme form of tunnel vision are unable to see the forest for the trees.
Thursday, January 26, 2012
Intermediate outcomes
Andrew Gelman’s post on the “fight” between Martin Lindquist and Michael Sobel on one side and Judea Pearl and Clark Glymour on the other is strictly for those who are familiar with directed graphical models (DGMs) which also include certain types of structural equation models (SEMs). But this is the second post he has made of late on intermediate outcomes. (Here’s his other post.)
I have nothing to add really except that the phrase intermediate outcomes reminded me of the book Because A Little Bug Went Ka-choo which is full of intermediate outcomes.
I have nothing to add really except that the phrase intermediate outcomes reminded me of the book Because A Little Bug Went Ka-choo which is full of intermediate outcomes.
Wednesday, September 14, 2011
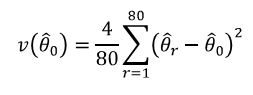
How to use replicate weights with SAS - American Community Survey or Current Population SurveyFor some reason, there are negative replicate weights in the ACS data. (I don’t know if this is the case with the CPS data.) data acs; set a.acs; array temp(*) pwgtp1-pwgtp80; do i = 1 to dim(temp); if temp(i) < 0 then temp(i)=0; end; run; proc surveymeans data = indiana varmethod=jackknife; var agep; weight pwgtp; repweights pwgtp1-pwgtp80 / jkcoefs=0.05; run; The value for jkcoefs (4/80=0.05) comes from the documentation for variance estimation (chapter 12 of the design methodology):
For some reason, there are negative replicate weights in the ACS data. (I don’t know if this is the case with the CPS data.) See also IPUMS.
data acs;
set a.acs;
array temp(*) pwgtp1-pwgtp80;
do i = 1 to dim(temp);
if temp(i) < 0 then temp(i)=0;
end;
run;
proc surveymeans data = indiana varmethod=jackknife;
var agep;
weight pwgtp;
repweights pwgtp1-pwgtp80 / jkcoefs=0.05;
run;
The value for jkcoefs (4/80=0.05) comes from the documentation for variance estimation (chapter 12 of the design methodology):
data acs;
set a.acs;
array temp(*) pwgtp1-pwgtp80;
do i = 1 to dim(temp);
if temp(i) < 0 then temp(i)=0;
end;
run;
proc surveymeans data = indiana varmethod=jackknife;
var agep;
weight pwgtp;
repweights pwgtp1-pwgtp80 / jkcoefs=0.05;
run;
The value for jkcoefs (4/80=0.05) comes from the documentation for variance estimation (chapter 12 of the design methodology):
Update: I believe the following statements will also work but haven't verified this:
proc surveymeans data = indiana varmethod=brr (fay=0.5);
var agep;
weight pwgtp;
repweights pwgtp1-pwgtp80;
run;
proc surveymeans data = indiana varmethod=brr (fay=0.5);
var agep;
weight pwgtp;
repweights pwgtp1-pwgtp80;
run;
Tuesday, April 12, 2011
Multiple comparisons
Wikipedia describes this problem as the following:
In statistics, the multiple comparisons or multiple testing problem occurs when one considers a set of statistical inferences simultaneously.[1] Errors in inference, including confidence intervals that fail to include their corresponding population parameters or hypothesis tests that incorrectly reject the null hypothesis are more likely to occur when one considers the set as a whole. Several statistical techniques have been developed to prevent this from happening, allowing significance levels for single and multiple comparisons to be directly compared. These techniques generally require a stronger level of evidence to be observed in order for an individual comparison to be deemed "significant", so as to compensate for the number of inferences being made.
Some examples (again from Wikipedia):
The question I have is the following: What if I refuse to test for some of the additional attributes/symptoms or hypotheses? Does this make the multiple comparison problem go away? If I ignore the fact that there are possibly other hypotheses out there which I do not specifically test for does this make my results more valid in the sense that I do not have to adjust for the confidence interval or level of significance? What if all studies did this - just focus on the hypothesis of interest and ignore all other testable hypothesis within their model or experiment?
In statistics, the multiple comparisons or multiple testing problem occurs when one considers a set of statistical inferences simultaneously.[1] Errors in inference, including confidence intervals that fail to include their corresponding population parameters or hypothesis tests that incorrectly reject the null hypothesis are more likely to occur when one considers the set as a whole. Several statistical techniques have been developed to prevent this from happening, allowing significance levels for single and multiple comparisons to be directly compared. These techniques generally require a stronger level of evidence to be observed in order for an individual comparison to be deemed "significant", so as to compensate for the number of inferences being made.
Some examples (again from Wikipedia):
- Suppose the treatment is a new way of teaching writing to students, and the control is the standard way of teaching writing. Students in the two groups can be compared in terms of grammar, spelling, organization, content, and so on. As more attributes are compared, it becomes more likely that the treatment and control groups will appear to differ on at least one attribute.
- Suppose we consider the efficacy of a drug in terms of the reduction of any one of a number of disease symptoms. As more symptoms are considered, it becomes more likely that the drug will appear to be an improvement over existing drugs in terms of at least one symptom.
- Suppose we consider the safety of a drug in terms of the occurrences of different types of side effects. As more types of side effects are considered, it becomes more likely that the new drug will appear to be less safe than existing drugs in terms of at least one side effect.
The question I have is the following: What if I refuse to test for some of the additional attributes/symptoms or hypotheses? Does this make the multiple comparison problem go away? If I ignore the fact that there are possibly other hypotheses out there which I do not specifically test for does this make my results more valid in the sense that I do not have to adjust for the confidence interval or level of significance? What if all studies did this - just focus on the hypothesis of interest and ignore all other testable hypothesis within their model or experiment?
Friday, July 16, 2010
Earthquakes
This mornings tremor shook me out of my sleep. Now I can safely say I've experienced a mild earthquake and it left me slightly queasy.
Judging by the number of earthquakes this year versus other years, e.g. 2009, it's hard to say if its been a more active year or not even though in my mind it feels like it has.
It would be interesting to see if there are any patterns via spatial and temporal autocorrelations - I'm familiar with autocorrelations in time series, less so spatial and don't even know if we can combine both.
Judging by the number of earthquakes this year versus other years, e.g. 2009, it's hard to say if its been a more active year or not even though in my mind it feels like it has.
It would be interesting to see if there are any patterns via spatial and temporal autocorrelations - I'm familiar with autocorrelations in time series, less so spatial and don't even know if we can combine both.
Friday, May 21, 2010
What I've always wondered about convergence
But was afraid to ask until it was asked for me: Why does anyone care about the distinction between convergence in probability and almost sure convergence?
Some answers:
1. "Suppose a person takes a bow and starts shooting arrows at a target. Let Xn be his score in n-th shot. Initially he will be very likely to score zeros, but as the time goes and his archery skill increases, he will become more and more likely to hit the bullseye and score 10 points. After the years of practice the probability that he hit anything but 10 will be getting increasingly smaller and smaller. Thus, the sequence Xn converges in probability to X = 10.Note that Xn does not converge almost surely however. No matter how professional the archer becomes, there will always be a small probability of making an error. Thus the sequence {Xn} will never turn stationary: there will always be non-perfect scores in it, even if they are becoming increasingly less frequent."
Also, almost sure convergence implies convergence in probability.
2. The most useful intuitive understanding I've been taught is that almost sure convergence guarantees that X_n be far from X (ie. further than any epsilon) only a finite number of times. Convergence in probability leaves open the possibility that X_n will be far from X an infinite number of times.
The best example I have to illustrate that is if you take Y_n as a Bernoulli(1/n) random variable. Clearly Y_n converges to 0 in probability, but it doesn't converge almost surely. Y_n will always be 1 for an infinite number of n's. You can see this from the second Borel-Cantelli Lemma.
Of course, I've got no idea if the distinction has any practical relevance for econometrics.
3. Convergence in probability is a form of weak convergence. Your students should understand the difference between convergence and weak convergence -- the difference is huge. If you have a sequence x_n, then weak convergence means that f(x_n) --> L for some f. This does not mean that x_n converges, but only that some attribute converges.
For example, you can ask, given N asset prices, if the sum of these prices converges to 1, does that mean that each individual asset price converges to something? No. Here f is the operation of taking the sum. It could be average, variance, integration against a test function, the infimum of a large set of integrations against test functions, whatever. ... Weak convergence, point-wise convergence, and uniform convergence are different concepts and useful ideas to understand, and they appear over and over again in different forms whatever branch of math you are studying.
Some answers:
1. "Suppose a person takes a bow and starts shooting arrows at a target. Let Xn be his score in n-th shot. Initially he will be very likely to score zeros, but as the time goes and his archery skill increases, he will become more and more likely to hit the bullseye and score 10 points. After the years of practice the probability that he hit anything but 10 will be getting increasingly smaller and smaller. Thus, the sequence Xn converges in probability to X = 10.Note that Xn does not converge almost surely however. No matter how professional the archer becomes, there will always be a small probability of making an error. Thus the sequence {Xn} will never turn stationary: there will always be non-perfect scores in it, even if they are becoming increasingly less frequent."
Also, almost sure convergence implies convergence in probability.
2. The most useful intuitive understanding I've been taught is that almost sure convergence guarantees that X_n be far from X (ie. further than any epsilon) only a finite number of times. Convergence in probability leaves open the possibility that X_n will be far from X an infinite number of times.
The best example I have to illustrate that is if you take Y_n as a Bernoulli(1/n) random variable. Clearly Y_n converges to 0 in probability, but it doesn't converge almost surely. Y_n will always be 1 for an infinite number of n's. You can see this from the second Borel-Cantelli Lemma.
Of course, I've got no idea if the distinction has any practical relevance for econometrics.
3. Convergence in probability is a form of weak convergence. Your students should understand the difference between convergence and weak convergence -- the difference is huge. If you have a sequence x_n, then weak convergence means that f(x_n) --> L for some f. This does not mean that x_n converges, but only that some attribute converges.
For example, you can ask, given N asset prices, if the sum of these prices converges to 1, does that mean that each individual asset price converges to something? No. Here f is the operation of taking the sum. It could be average, variance, integration against a test function, the infimum of a large set of integrations against test functions, whatever. ... Weak convergence, point-wise convergence, and uniform convergence are different concepts and useful ideas to understand, and they appear over and over again in different forms whatever branch of math you are studying.
Tuesday, December 8, 2009
Simulating mixed models
I've been sitting on this post - no longer sure why I have it bookmarked nor why glmm models are being simulated using a gamma or negative binomial distribution. At some point I must have been wanting to do this but in the context of a multi-level model. I'm not sure how this has any relevance any more which reminds me that the adage "Do it now" really needs to be applied in my case.
Friday, December 4, 2009
Unemployment rate of college graduates
This post on how a GWU student was not able to find employment in the current economic climate made me wonder how bad unemployment was among recent college graduates.
The WSJ ran a story on Simpson's paradox and the"mystery" of why the following is the case:
Measured by unemployment, the answer appears to be no, or at least not yet. The jobless rate was 10.2% in October, compared with a peak of 10.8% in November and December of 1982.
But viewed another way, the current recession looks worse, not better. The unemployment rate among college graduates is higher than during the 1980s recession. Ditto for workers with some college, high-school graduates and high-school dropouts.
So how can the overall unemployment rate be lower today but higher among each group?
It also provided this graphic:
The rate looked low to me for college graduates (green) at 4.9% which is higher than 3.6%. (Dropouts are red at 14.9% and all adults 25 and over is black.)
Unfotunately, the BLS data does not provide an educational breakdown for the age 20-24 group which is the group that is of interest in the article. Among this age group (all educational levels), the unemployment rate as of Oct 2009 was 15.6 % compared to Oct 1982 of 15.8%.
If we're taking the past to be a reflection of the future then it doesn't look too good for this age group. The monthly unemployment rates in 1982 continue to increase before declining in March, 1983.
Nov 1982: 16.4%
Dec 1982: 16.3%
Jan 1983: 16.0%
Feb 1983: 16.2%
Mar 1983: 15.6%
These numbers do not take into account the measurement errors around the estimates of the unemployment rates (so, for instance, 15.8% may not be statistically different from 15.6%).
The WSJ ran a story on Simpson's paradox and the"mystery" of why the following is the case:
Measured by unemployment, the answer appears to be no, or at least not yet. The jobless rate was 10.2% in October, compared with a peak of 10.8% in November and December of 1982.
But viewed another way, the current recession looks worse, not better. The unemployment rate among college graduates is higher than during the 1980s recession. Ditto for workers with some college, high-school graduates and high-school dropouts.
So how can the overall unemployment rate be lower today but higher among each group?
It also provided this graphic:

The rate looked low to me for college graduates (green) at 4.9% which is higher than 3.6%. (Dropouts are red at 14.9% and all adults 25 and over is black.)
Unfotunately, the BLS data does not provide an educational breakdown for the age 20-24 group which is the group that is of interest in the article. Among this age group (all educational levels), the unemployment rate as of Oct 2009 was 15.6 % compared to Oct 1982 of 15.8%.
If we're taking the past to be a reflection of the future then it doesn't look too good for this age group. The monthly unemployment rates in 1982 continue to increase before declining in March, 1983.
Nov 1982: 16.4%
Dec 1982: 16.3%
Jan 1983: 16.0%
Feb 1983: 16.2%
Mar 1983: 15.6%
These numbers do not take into account the measurement errors around the estimates of the unemployment rates (so, for instance, 15.8% may not be statistically different from 15.6%).
Thursday, December 3, 2009
Generating correlated random variables using SAS
This code is based on the discussion on SITMO. It uses two ways to generate correlated random variables. For any correlation matrix, C,
1) Find the Cholesky decomposition. In SAS, this uses the root function in IML. Multiply the Cholesky decomposition to a matrix of randomly generated numbers.
2) Find the eigenvalues and eigenvectors. In SAS, the function is call eigen in IML. The eigenvectors pre-multiplied with the diagonalized eigenvalues results in a matrix V. Multiply the transpose of V with the matrix of randomly generated numbers.
The product of this multiplication results in a matrix of correlated series.
The code:
proc iml;
C={1 0.6 0.3, 0.6 1 0.5, 0.3 0.5 1};
/* Method 1 uses the Cholesky decomposition */
U=root(C);
/* Method 2 uses the eigenvalues and eigenvectors */
call eigen(eival, eivec, c);
v=eivec*(diag(sqrt(eival)));
vt=t(v);
call randseed(12345);
/* Generate 3 random series 500 in length */
randm = j(500,3,.);
call randgen(randm,'NORMAL');
corr = randm * U;
corrv = randm * vt;
create random_data from randm;
append from randm;
create correlated_data from corr;
append from corr;
create correlated_data_v from corrv;
append from corrv;
quit;
title1 'Correlation of randomly generated data';
proc corr data = random_data;
run;
title1 'Correlation of data using Cholesky decomposition';
proc corr data = correlated_data;
run;
title1 'Correlation of data using Eigenvalue and Eigenvector decomposition';
proc corr data = correlated_data_v;
run;
Note that the correlation using 500 numbers may not give the exact correlation as in the C matrix. A longer series may be required, e.g. 1000.
1) Find the Cholesky decomposition. In SAS, this uses the root function in IML. Multiply the Cholesky decomposition to a matrix of randomly generated numbers.
2) Find the eigenvalues and eigenvectors. In SAS, the function is call eigen in IML. The eigenvectors pre-multiplied with the diagonalized eigenvalues results in a matrix V. Multiply the transpose of V with the matrix of randomly generated numbers.
The product of this multiplication results in a matrix of correlated series.
The code:
proc iml;
C={1 0.6 0.3, 0.6 1 0.5, 0.3 0.5 1};
/* Method 1 uses the Cholesky decomposition */
U=root(C);
/* Method 2 uses the eigenvalues and eigenvectors */
call eigen(eival, eivec, c);
v=eivec*(diag(sqrt(eival)));
vt=t(v);
call randseed(12345);
/* Generate 3 random series 500 in length */
randm = j(500,3,.);
call randgen(randm,'NORMAL');
corr = randm * U;
corrv = randm * vt;
create random_data from randm;
append from randm;
create correlated_data from corr;
append from corr;
create correlated_data_v from corrv;
append from corrv;
quit;
title1 'Correlation of randomly generated data';
proc corr data = random_data;
run;
title1 'Correlation of data using Cholesky decomposition';
proc corr data = correlated_data;
run;
title1 'Correlation of data using Eigenvalue and Eigenvector decomposition';
proc corr data = correlated_data_v;
run;
Note that the correlation using 500 numbers may not give the exact correlation as in the C matrix. A longer series may be required, e.g. 1000.
Thursday, September 17, 2009
What does rejecting the null imply?
1. Test the null that two alternatives are the same (i.e. the mean difference is zero)
2. If the null is not rejected this does not imply that we accept the null that the two alternatives are the same. All we can say is that the two alternatives are not different, which is not the same thing as saying that it is the same. This is the conservative interpretation that was drilled into us in graduate school. (Splitting hairs or angels dancing on a pin?)
3. If the null is rejected, then we can say that the two alternatives are different. In fact, we can say that the two alternatives are not the same. But, can we conclude that one is better than the other, i.e. if the mean difference is positive?
This is what I am wrestling with when reading:
Early Education Policy Alternatives: Comparing Quality and Outcomes of Head Start and State Prekindergarten by Gary T Henry, Craig S Gordon and Dana K Rickman
In the paper, I conclude that the quality difference between state pre kindergarten programs are Head Start programs are different, i.e. we can reject the null that they are the same. (See paper for various measures of qualities and outcomes. For instance, kids in pre kindergarten do better in standardized tests a couple of years later than Head Start kids, Head Start centers/programs do not have as many teachers with BA as state pre-K programs, etc.)
In fact the differences are positive on the side of state pre-K programs but instead of concluding that these programs are better than Head Start, the authors choose to word it as follows (from the abstract, emphasis mine):
The two groups were statistically similar at the beginning of their preschool year on three of four direct assessments (p less than 0.05), but by the beginning of kindergarten the children attending the state prekindergarten program posted higher developmental outcomes on five of six direct assessments (p less than 0.05) and 14 of 17 ratings by kindergarten teachers (p less than 0.05). This study indicates that economically disadvantaged children who attended Georgia's universal prekindergarten entered kindergarten at least as well prepared as similar children who attended the Head Start program.
Can we not conclude that kids entering state pre-K programs are better off than Head Start kids? Or, that Head Start kids are worse off than prekindergarten kids?
2. If the null is not rejected this does not imply that we accept the null that the two alternatives are the same. All we can say is that the two alternatives are not different, which is not the same thing as saying that it is the same. This is the conservative interpretation that was drilled into us in graduate school. (Splitting hairs or angels dancing on a pin?)
3. If the null is rejected, then we can say that the two alternatives are different. In fact, we can say that the two alternatives are not the same. But, can we conclude that one is better than the other, i.e. if the mean difference is positive?
This is what I am wrestling with when reading:
Early Education Policy Alternatives: Comparing Quality and Outcomes of Head Start and State Prekindergarten by Gary T Henry, Craig S Gordon and Dana K Rickman
In the paper, I conclude that the quality difference between state pre kindergarten programs are Head Start programs are different, i.e. we can reject the null that they are the same. (See paper for various measures of qualities and outcomes. For instance, kids in pre kindergarten do better in standardized tests a couple of years later than Head Start kids, Head Start centers/programs do not have as many teachers with BA as state pre-K programs, etc.)
In fact the differences are positive on the side of state pre-K programs but instead of concluding that these programs are better than Head Start, the authors choose to word it as follows (from the abstract, emphasis mine):
The two groups were statistically similar at the beginning of their preschool year on three of four direct assessments (p less than 0.05), but by the beginning of kindergarten the children attending the state prekindergarten program posted higher developmental outcomes on five of six direct assessments (p less than 0.05) and 14 of 17 ratings by kindergarten teachers (p less than 0.05). This study indicates that economically disadvantaged children who attended Georgia's universal prekindergarten entered kindergarten at least as well prepared as similar children who attended the Head Start program.
Can we not conclude that kids entering state pre-K programs are better off than Head Start kids? Or, that Head Start kids are worse off than prekindergarten kids?
Thursday, August 6, 2009
Reconciling EHS and HS results
It is difficult to reconcile the positive (and large) effects of Early Head Start on 3 year olds with the lack of positive findings in the first year of the first year findings of Head Start impact study. It is possible that the positive effects found are overstated because it does not take the effects of sample design on standard errors.
Something as important (and controversial) as childhood development assessment does not need sampling design effects to further confound the public. It is therefore hard to reconcile the resistance against the Head Start National Reporting system (HSNRS) that tested every child (as much as possible) in Head Start and was not subject to sample design effects with the desire and even need to see positive impacts of Head Start. The resistance stems entirely from the appropriateness of the assessments used in HSNRS.
The challenge for early childhood educators is to come up with a way of assessing impact appropriately. Why should this be so difficult when parents can (and are even encouraged to) use developmental milestones to guide them in seeing if their child is showing adequate progress?
There is a vocal minority who believe that children should NEVER be tested at such an early age (3-5) and it is possible that this is the minority who are driving public policy regardless of any desire to investigate the effectiveness of Head Start. Moreover, they (and others) believe (perhaps correctly) that the research is used to drive funding and not improvement of programs. Less effective (however defined) programs would be defunded rather than shown how to improve. Does politics trump the need to find out if such programs are effective and how these programs can be improved?
References:
Samuel J Meisels and Sally Atkins Burnett, The Head Start National Reporting System: A Critique
John M Love, et. al., The Effectiveness of Early Head Start for 3-Year-Old Children and Their Parents: Lessons for Policy and Programs
Something as important (and controversial) as childhood development assessment does not need sampling design effects to further confound the public. It is therefore hard to reconcile the resistance against the Head Start National Reporting system (HSNRS) that tested every child (as much as possible) in Head Start and was not subject to sample design effects with the desire and even need to see positive impacts of Head Start. The resistance stems entirely from the appropriateness of the assessments used in HSNRS.
The challenge for early childhood educators is to come up with a way of assessing impact appropriately. Why should this be so difficult when parents can (and are even encouraged to) use developmental milestones to guide them in seeing if their child is showing adequate progress?
There is a vocal minority who believe that children should NEVER be tested at such an early age (3-5) and it is possible that this is the minority who are driving public policy regardless of any desire to investigate the effectiveness of Head Start. Moreover, they (and others) believe (perhaps correctly) that the research is used to drive funding and not improvement of programs. Less effective (however defined) programs would be defunded rather than shown how to improve. Does politics trump the need to find out if such programs are effective and how these programs can be improved?
References:
Samuel J Meisels and Sally Atkins Burnett, The Head Start National Reporting System: A Critique
John M Love, et. al., The Effectiveness of Early Head Start for 3-Year-Old Children and Their Parents: Lessons for Policy and Programs
Tuesday, January 27, 2009
Economics can learn from psychometrics
This post by Andrew Gelman on how statisticians seem to rediscover something that psychometricians have already discovered a ong time ago made me think that economics can benefit from the study of psychometrics as well. I am thinking in particular of index number creation or measures of latent ability such as SATs. Economists use test scores as outcomes all the time yet do not adopt psychometric elements into their research.
One possible avenue is the stress of an economy that was pondered here. Others are possibly comparing WB Governance Indicators to those created using psychometric techniques.
One possible avenue is the stress of an economy that was pondered here. Others are possibly comparing WB Governance Indicators to those created using psychometric techniques.
Sunday, June 22, 2008
Test-retest reliability in golf
Having been peripherally involved in psychometrics I found this post Is the Ultimate Test in Golf Unreliable interesting:
"... here are the correlations for the four rounds played at the Memorial Tournament two weeks ago. Basically these correlations all hover around 0. There is no evidence here that the rank ordering of participants from round to round has any appreciable level of stability. And yet $6 million of prize money was doled out on the basis of this selection process."
However, in order to be conclusive, this exercise needs to be repeated for many tournaments or at least a series of tournaments, e.g. all USGA or all LPGA. The post also shows correlations of rankings rather than correlations of scores which I think will make a difference since the test-retest reliability involves actual scores rather than rankings.
Recall that rankings for the top 10 at any end of the day may be separated by only very few strokes so it is possible for someone to score the same score on two days but be at very different positions of the ranking.
"... here are the correlations for the four rounds played at the Memorial Tournament two weeks ago. Basically these correlations all hover around 0. There is no evidence here that the rank ordering of participants from round to round has any appreciable level of stability. And yet $6 million of prize money was doled out on the basis of this selection process."
However, in order to be conclusive, this exercise needs to be repeated for many tournaments or at least a series of tournaments, e.g. all USGA or all LPGA. The post also shows correlations of rankings rather than correlations of scores which I think will make a difference since the test-retest reliability involves actual scores rather than rankings.
Recall that rankings for the top 10 at any end of the day may be separated by only very few strokes so it is possible for someone to score the same score on two days but be at very different positions of the ranking.
Sunday, March 30, 2008
Hypothesis testing
Andrew Gelman points to an article on The Fallacy of Hypothesis Testing. I'm not sure I agree with everything in the article but this paragraph caught my eye:
Third, I've learned that the scientific community's emphasis on hypothesis-based research leads too many scientists to devise experiments to prove, rather than test, their hypotheses. Many journal submissions lack any discussion of alternative competing hypotheses: Researchers don't seem to realize that collecting data that are consistent with their original hypothesis doesn't mean that it is unconditionally true. Alternatively, they buy into the fallacy that absence of evidence for something is always evidence of its absence.
Gelman responds:
... I imagine many of my social science colleagues could present a defense of hypothesis testing. (Just to be clear, I think we're talking here about the idea of posing and testing hypotheses, not the textbook statistical methods called "hypothesis testing." The hyp testing that Pepperberg is talking about could just as easily be done using confidence intervals or whatever; her real distinction, I think, is between studies that are exploratory and studies that are designed to test particular scientific theories.
The general criticism seem to be that hypothesis testing is conducted in the absence of competing models. But if different models lead to the same hypothesis test then the question seems to be one of differentiating between alternative models.
Third, I've learned that the scientific community's emphasis on hypothesis-based research leads too many scientists to devise experiments to prove, rather than test, their hypotheses. Many journal submissions lack any discussion of alternative competing hypotheses: Researchers don't seem to realize that collecting data that are consistent with their original hypothesis doesn't mean that it is unconditionally true. Alternatively, they buy into the fallacy that absence of evidence for something is always evidence of its absence.
Gelman responds:
... I imagine many of my social science colleagues could present a defense of hypothesis testing. (Just to be clear, I think we're talking here about the idea of posing and testing hypotheses, not the textbook statistical methods called "hypothesis testing." The hyp testing that Pepperberg is talking about could just as easily be done using confidence intervals or whatever; her real distinction, I think, is between studies that are exploratory and studies that are designed to test particular scientific theories.
The general criticism seem to be that hypothesis testing is conducted in the absence of competing models. But if different models lead to the same hypothesis test then the question seems to be one of differentiating between alternative models.
Friday, January 18, 2008
Risk versus uncertainty
Andrew Gelman pointed to this article by Nassim Taleb which I found interesting:
The Irrelevance of "Probability"
I spent a long time believing in the centrality of probability in life and advocating that we should express everything in terms of degrees of credence, with unitary probabilities as a special case for total certainties, and null for total implausibility. Critical thinking, knowledge, beliefs, everything needed to be probabilized. Until I came to realize, twelve years ago, that I was wrong in this notion that the calculus of probability could be a guide to life and help society. Indeed, it is only in very rare circumstances that probability (by itself) is a guide to decision making . It is a clumsy academic construction, extremely artificial, and nonobservable. Probability is backed out of decisions; it is not a construct to be handled in a standalone way in real-life decision-making. It has caused harm in many fields.
Consider the following statement. "I think that this book is going to be a flop. But I would be very happy to publish it." Is the statement incoherent? Of course not: even if the book was very likely to be a flop, it may make economic sense to publish it (for someone with deep pockets and the right appetite) since one cannot ignore the small possibility of a handsome windfall, or the even smaller possibility of a huge windfall. We can easily see that when it comes to small odds, decision making no longer depends on the probability alone. It is the pair probability times payoff (or a series of payoffs), the expectation, that matters. On occasion, the potential payoff can be so vast that it dwarfs the probability — and these are usually real world situations in which probability is not computable.
Consequently, there is a difference between knowledge and action. You cannot naively rely on scientific statistical knowledge (as they define it) or what the epistemologists call "justified true belief" for non-textbook decisions. Statistically oriented modern science is typically based on Right/Wrong with a set confidence level, stripped of consequences. Would you take a headache pill if it was deemed effective at a 95% confidence level? Most certainly. But would you take the pill if it is established that it is "not lethal" at a 95% confidence level? I hope not.
I would add another interpretation as well: Knowing the probabilities for success or failure is a known risk. Even though I know the risks I may not act to follow up on the actions associated with the risk (using some expected utility maximization framework with risk aversion) even though it may be beneficial. This is what I would think of as individual uncertainty - I don't know how well or badly I can handle the consequences of the action. Perhaps this is just heterogeneity in risk aversion and I am just more risk averse than average. But regardless -- economists consider risk as something that is quantifiable whereas uncertainty is not -- at the individual level all risk is unquantifiable so at this level, all risk is uncertainty.
The Irrelevance of "Probability"
I spent a long time believing in the centrality of probability in life and advocating that we should express everything in terms of degrees of credence, with unitary probabilities as a special case for total certainties, and null for total implausibility. Critical thinking, knowledge, beliefs, everything needed to be probabilized. Until I came to realize, twelve years ago, that I was wrong in this notion that the calculus of probability could be a guide to life and help society. Indeed, it is only in very rare circumstances that probability (by itself) is a guide to decision making . It is a clumsy academic construction, extremely artificial, and nonobservable. Probability is backed out of decisions; it is not a construct to be handled in a standalone way in real-life decision-making. It has caused harm in many fields.
Consider the following statement. "I think that this book is going to be a flop. But I would be very happy to publish it." Is the statement incoherent? Of course not: even if the book was very likely to be a flop, it may make economic sense to publish it (for someone with deep pockets and the right appetite) since one cannot ignore the small possibility of a handsome windfall, or the even smaller possibility of a huge windfall. We can easily see that when it comes to small odds, decision making no longer depends on the probability alone. It is the pair probability times payoff (or a series of payoffs), the expectation, that matters. On occasion, the potential payoff can be so vast that it dwarfs the probability — and these are usually real world situations in which probability is not computable.
Consequently, there is a difference between knowledge and action. You cannot naively rely on scientific statistical knowledge (as they define it) or what the epistemologists call "justified true belief" for non-textbook decisions. Statistically oriented modern science is typically based on Right/Wrong with a set confidence level, stripped of consequences. Would you take a headache pill if it was deemed effective at a 95% confidence level? Most certainly. But would you take the pill if it is established that it is "not lethal" at a 95% confidence level? I hope not.
I would add another interpretation as well: Knowing the probabilities for success or failure is a known risk. Even though I know the risks I may not act to follow up on the actions associated with the risk (using some expected utility maximization framework with risk aversion) even though it may be beneficial. This is what I would think of as individual uncertainty - I don't know how well or badly I can handle the consequences of the action. Perhaps this is just heterogeneity in risk aversion and I am just more risk averse than average. But regardless -- economists consider risk as something that is quantifiable whereas uncertainty is not -- at the individual level all risk is unquantifiable so at this level, all risk is uncertainty.
Subscribe to:
Posts (Atom)